Key Metrics Introduction (User Acquisition, Page Views & Unique Page Views, Demographic Details)
In this analysis, I used Google Analytics 4 (GA4) to evaluate website performance through three key areas: user acquisition, engagement, and demographic details.
These metrics are important because they provide insight into:
- User acquisition: Where users are coming from
- Page views & unique page views: What content users are interacting with
- Demographic details: Who the users are and where they are located
Understanding these metrics allows marketers to make data-driven decisions, improve targeting strategies, and optimize content to better meet user needs.
User Acquisition – First User Source/Medium
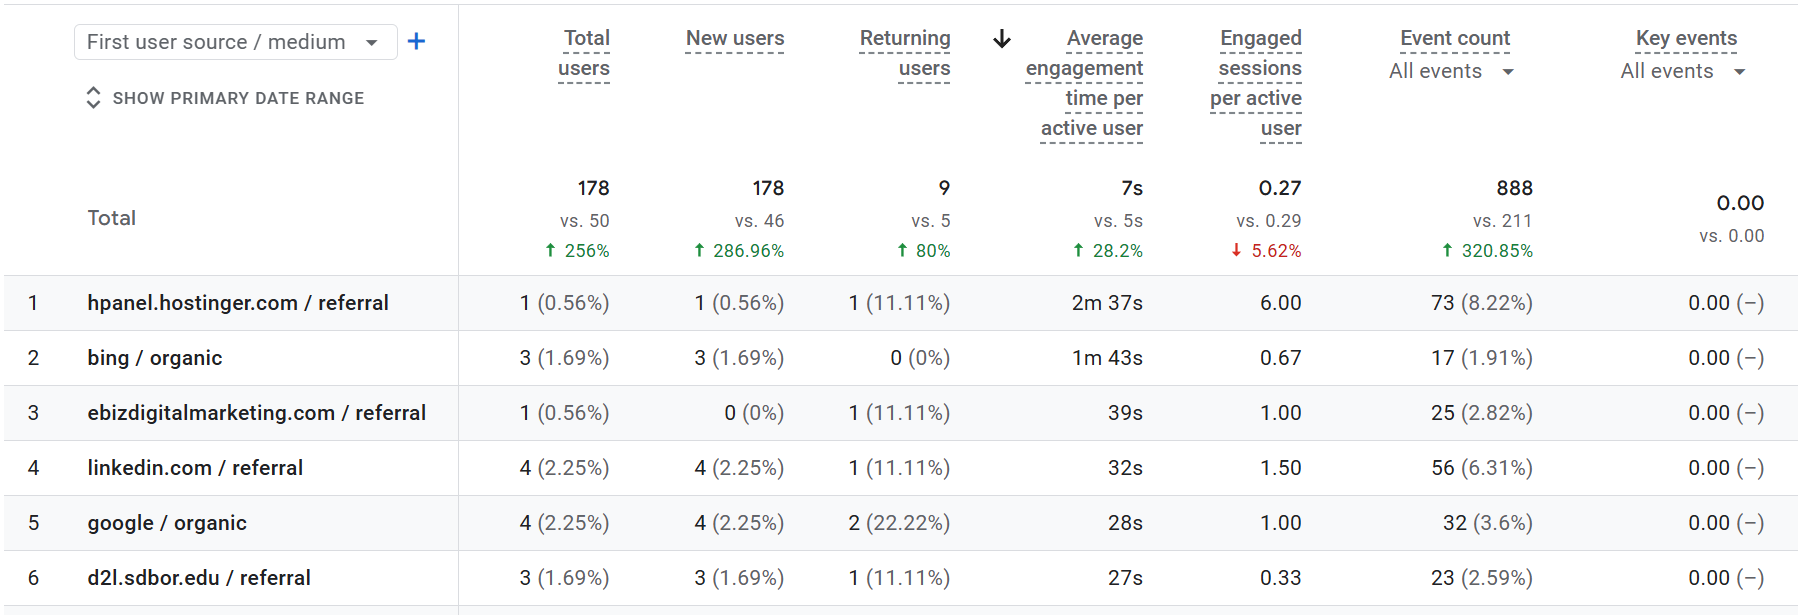
I used “First user source / medium” to understand how users initially discovered the website. This dimension is important because it identifies the original traffic source, helping determine which marketing channels are most effective at attracting new users.
Why I Used These Metrics
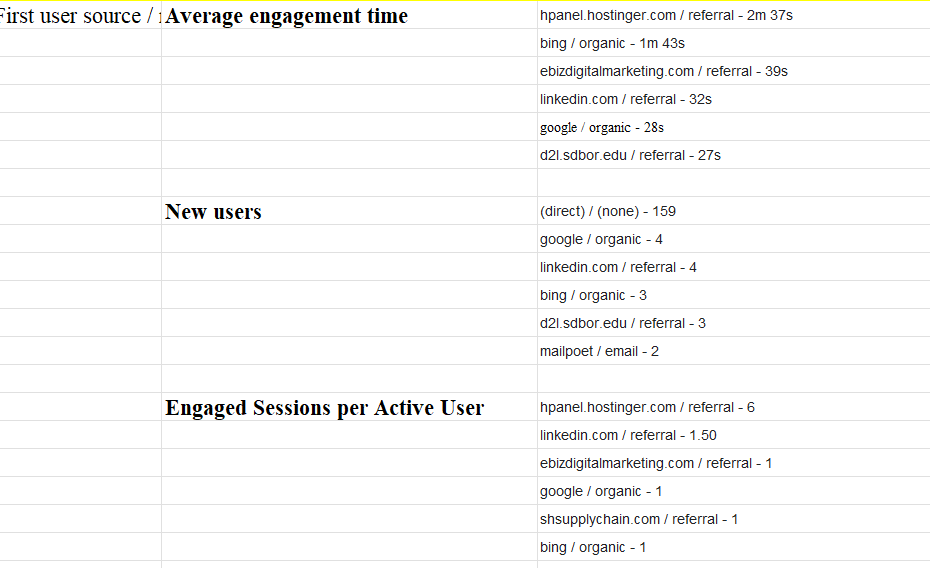
- Average engagement time per active user helps measure how long users from each source stay engaged
- New users shows how many first-time visitors each source brings
- Engaged sessions per active user indicates how actively users interact with the site
These metrics help evaluate both traffic quantity and traffic quality.
Describe What Prompts You Use for Each Metric Above
- “Which traffic source has the highest engagement time and what does that suggest?”
- “Compare new users across sources and identify which channel drives the most traffic.”
- “Which source has the highest engaged sessions per active user and what does that indicate about user quality?”
Result
The analysis shows that (direct) / (none) generated the highest number of new users (159), indicating strong direct traffic, possibly from bookmarks or untracked sources. However, this traffic had relatively low engagement.
In contrast, hpanel.hostinger.com / referral had the highest engagement time (2m 37s) and the highest engaged sessions per user (6), indicating extremely high interaction, though likely from a small or specific audience.
LinkedIn stood out as a strong external source, with higher engagement (1.50 engaged sessions per user) compared to other channels. Organic traffic from Google and Bing brought in users but with lower engagement levels.
Overall, this suggests that while direct traffic drives volume, LinkedIn and referral sources bring higher-quality users.
Engagement – Page Title and Screens
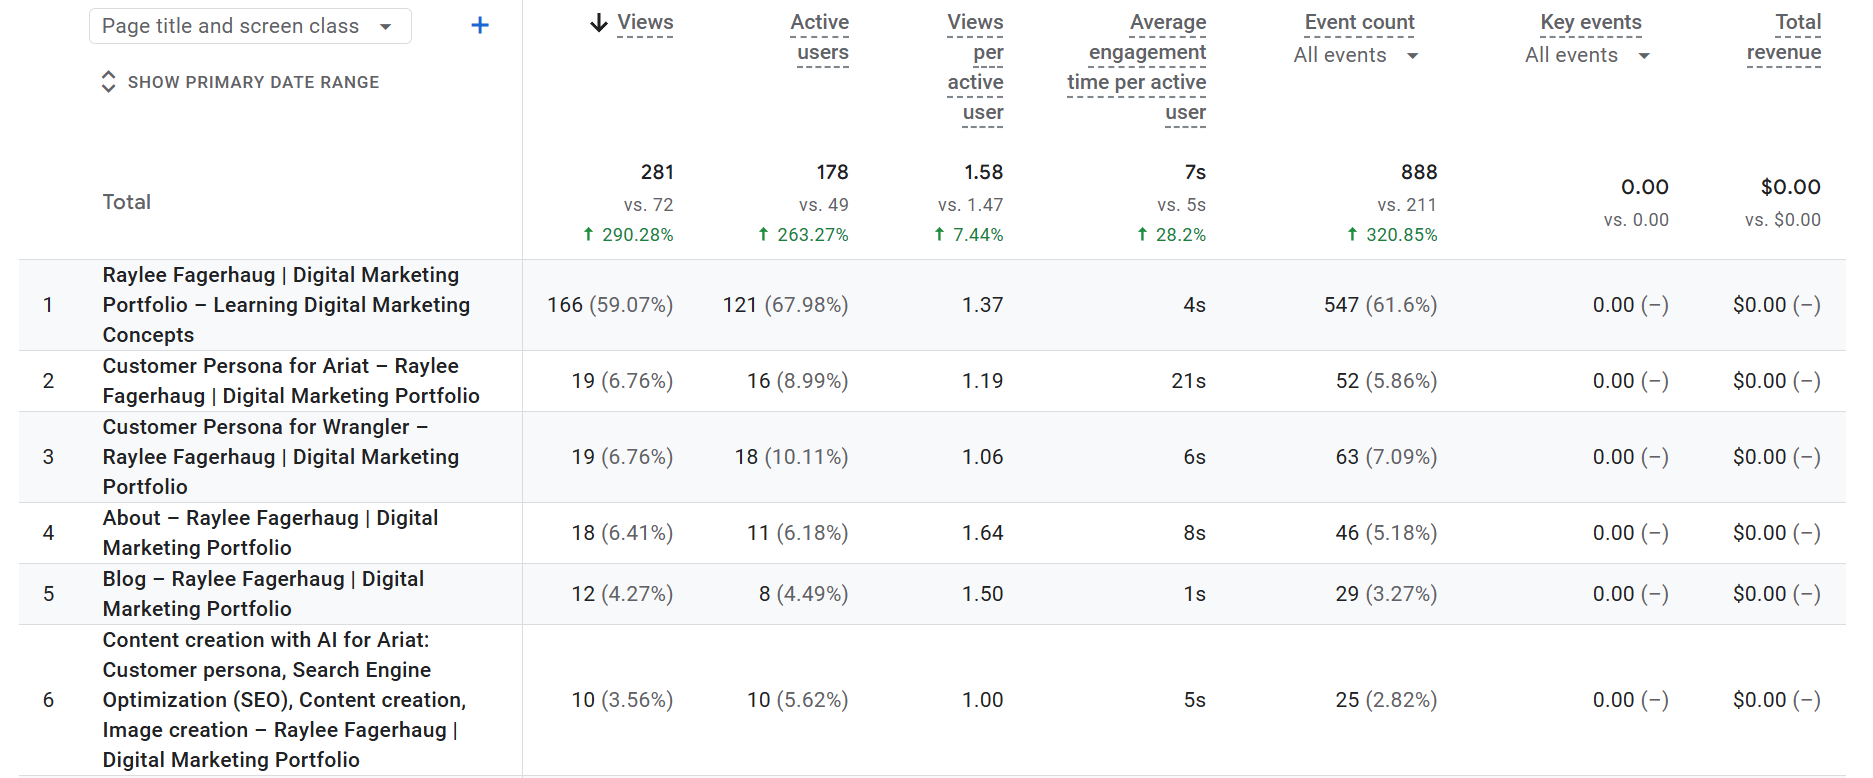
I used “Page title and screens” to analyze how users interact with specific pages on the website. This is important because it helps identify which content performs best and which areas may need improvement.
Why I Used These Metrics
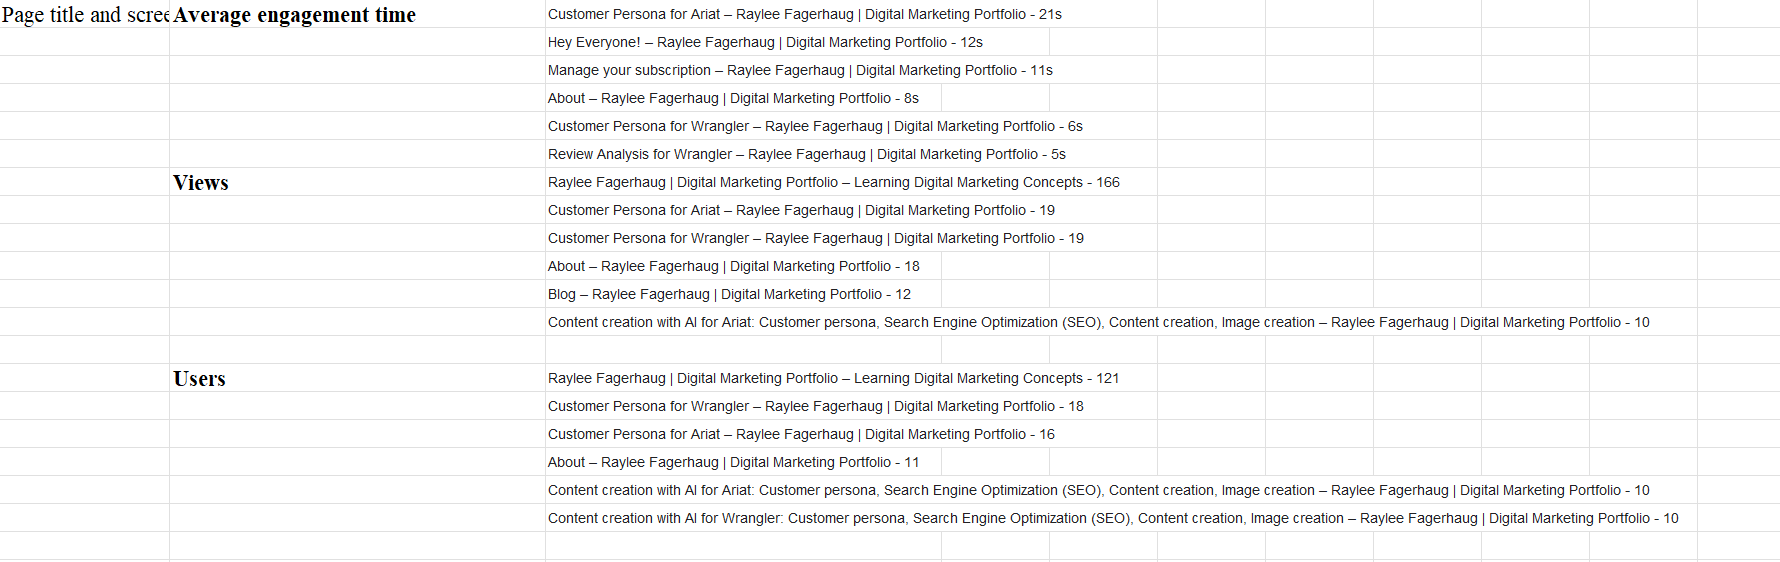
- Views show how often each page is visited
- Users indicate how many individuals visited each page
- Average engagement time per active user measures how engaging each page is
These metrics help evaluate content performance and user interest.
Describe What Prompts You Use for Each Metric Above
- “Which pages have the highest views and what does that suggest about user interest?”
- “Which pages have the highest engagement time and why?”
- “Identify pages with low engagement and suggest improvements.”
Result
The homepage (166 views, 121 users) received the most traffic, acting as the central entry point for users.
The Customer Persona pages (Ariat and Wrangler) performed well in both views and users, showing strong interest in marketing-related content. Additionally, the Ariat persona page had the highest engagement time (21s), indicating it is the most engaging piece of content.
Pages like About and Blog showed moderate performance, while more specialized content (such as AI-related pages) had lower views and engagement.
This suggests that users are most interested in customer persona content, while other pages may need better visibility or more engaging content.
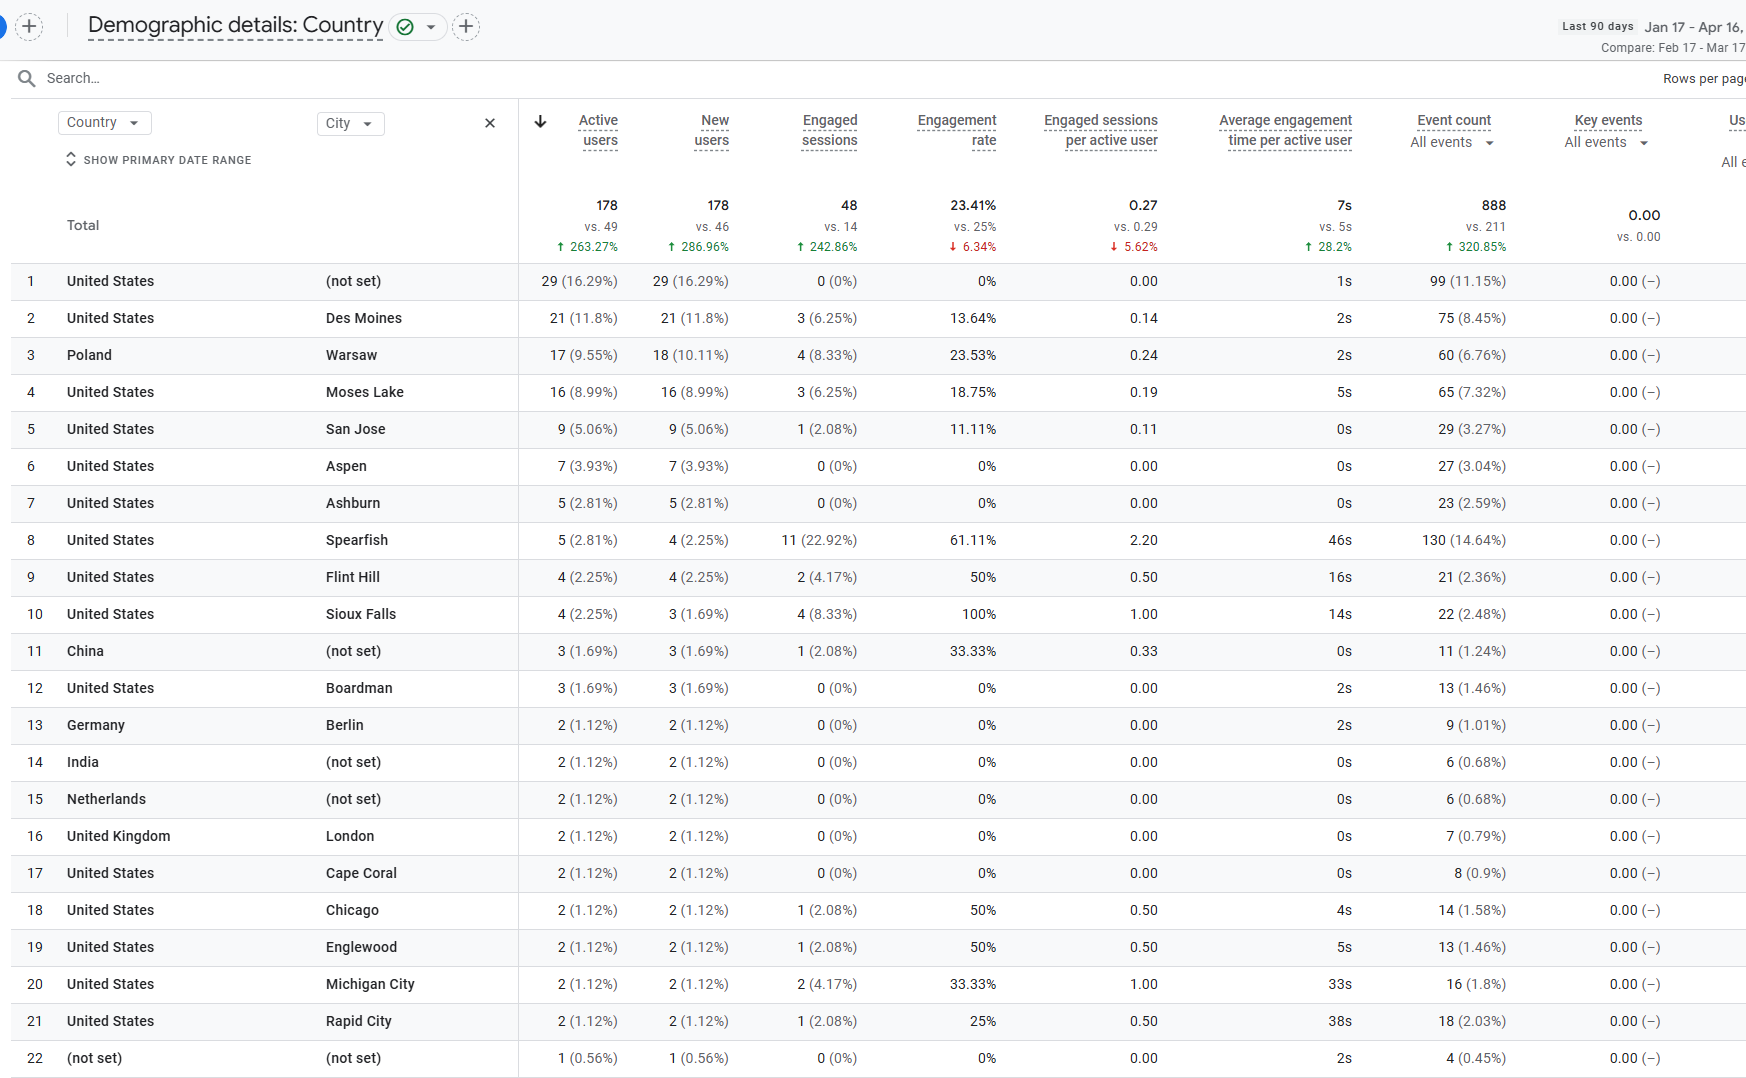
User Attribute – Demographic Details
I used “Country and City” to understand where users are located. This is important because it helps identify target audiences, evaluate geographic reach, and improve location-based marketing strategies.
Why I Used These Metrics
- Active users show audience size by location
- Engagement rate indicates how many users actively interact
- Average engagement time per active user measures how long users stay
- Engaged sessions per active user shows how often users interact
These metrics help evaluate both audience reach and engagement quality.
Describe What Prompts You Use for Each Metric Above
- “Which cities have the highest engagement rate and what does that suggest?”
- “Compare engagement time across cities and identify trends.”
- “Which locations bring high traffic but low engagement?”
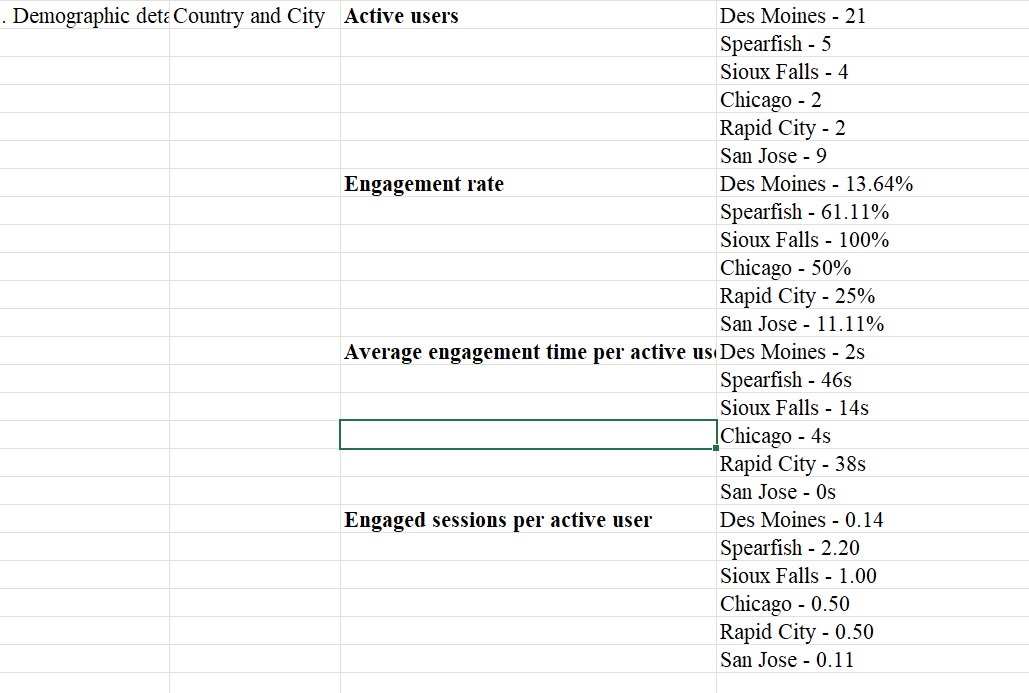
Result
The data shows that Des Moines had the highest number of users (21) but very low engagement (13.64% engagement rate, 2s average time, 0.14 sessions), indicating low-quality traffic.
In contrast, Spearfish showed the strongest overall engagement (61.11% engagement rate, 46s average time, 2.20 sessions), making it the highest-quality audience despite having fewer users.
Sioux Falls also performed well with a 100% engagement rate and consistent interaction.
Cities like San Jose and Chicago showed low engagement, suggesting users are not finding the content as relevant.
Conclusion
This analysis highlights the importance of looking beyond just traffic numbers. While some sources and locations generate higher user volume, they do not always result in strong engagement.
High-quality traffic, such as users from LinkedIn or locations like Spearfish, demonstrates stronger interaction and interest in the content. Moving forward, marketing efforts should focus on increasing both visibility and engagement quality by optimizing content, improving targeting, and leveraging high-performing channels.